Major results
Presently climate and vegetation maps for a middle Miocene (ca. 11.2 - 16.4 Ma) and an earlier late Miocene time slice (ca. 11.2 – 7.1 Ma) are available (Fig. 1). The maps are based on the palaeobotanical records (micro- and macrofloras) of 187 / 201 sites, most located in the Northern Hemisphere.
- Paleoclimate:
In both studied time slices, latitudinal temperature gradients were considerably reduced compared to the present. Highest anomalies (>30°C) are obtained for winter temperatures in the high latitudes. Temperatures in the lower latitudes were about at the present-day level, or even tend to be slightly cooler (middle Miocene, SE Asia).
Cenozoic climate cooling, in general, was more pronounced in the higher latitudes, and primarily affected winter temperatures. However, late Miocene high latitude anomalies are still very high, with a most probably low to moderate atmospheric CO2 level and the onset of Northern Hemisphere glaciation.
Miocene precipitation with respect to present was overall higher in the high and mid-latitudes, as well as in the continental interiors, while it tends to be lower in some lower latitudinal areas.
Cenozoic climate cooling in many regions is connected to an increase of polarity of precipitation. Seasonal drought increases in continental interiors of Eastern Eurasia and Northern America. Over Europe, a persistent gradient with permanently wet conditions in the Central part to seasonally drier conditions towards the SW (Spain) and SE (Black Sea area, parts of Turkey) existed. High northern latitudes (E Siberia and Far East of Russia) became all over drier in the late Miocene. -
Vegetation:
The reconstructed vegetation maps show presence of woodlands in the High Arctic and wide zonal extension of warm temperate forest types in both time slices studied.
The interpretation of diversity spectra of plant functional types is proven a useful tool to analyse vegetation patterns in relation to palaeoclimate. For example, it is shown that diversity gradients of xeric types follow patterns with seasonal rainfall, while diversity gradients of broadleaved evergreens are clearly related to temperature. -
Paleo-vegetation simulation and retrieval of palaeo-climate parameters through data assimilation:
For the Middle Miocene, several simulation experiments, where carried out using the EMIC Planet Simulator, where was assessed the effects of the absence of ice on the continents, the opening of the Central American and Eastern Tethys seaways, the lowering of the topography on land and the effect of various atmospheric CO2 concentrations. Paleovegetation distribution was calculated (Henrot et al., 2010) with the CARAIB Dynamic Vegetation Model, on the basis of these climate simulations (Fig. 2).
A vegetation distribution has also been produced for the Late Miocene, using climatic inputs from a Tortonian run with the COSMOS AOGCM. The resulting vegetation distribution has been compared over Europe to available palaeo-vegetation and pollen-data on a presence/absence basis (François et al., 2011). The modelled vegetation shows a wider distribution of subtropical types in the lower mid-latitudes of Europe when compared to present but is not capable to represent the warmth-loving vegetation observed in the fossil record of central and north Europe. Thus, discrepancies between modelled vegetation and data-based vegetation allow to assess the quality of COSMOS AOGCM run at a regional scale.
A variational data assimilation system based on the CARAIB model was designed to determine optimal climate parameters, which minimise vegetation simulations and observation misfit. The ongoing work consists in the use of observed PFTs fractions derived from fossil floras (using the methodology of François et al. 2011), as well as the estimated climate parameters trough the coexistence approach (Mosbrugger and Utescher 1997).

Figure 1: Multi-proxy precipitation data and vegetational diversity patterns. Maps on top left: evolution of precipitation patterns (MAP) during the late Miocene based on the analysis of small mammal communities (van Dam, 2006); top right: diversity of herbaceous PFTs (for explanation see corresponding figure caption above); bottom left: Tortonian MARP pattern obtained from our WP1 sites applying the Coexistence Approach. Bottom right: late Miocene hypsodonty patterns derived from large mammal plant-eaters (Fortelius et al., 2002)
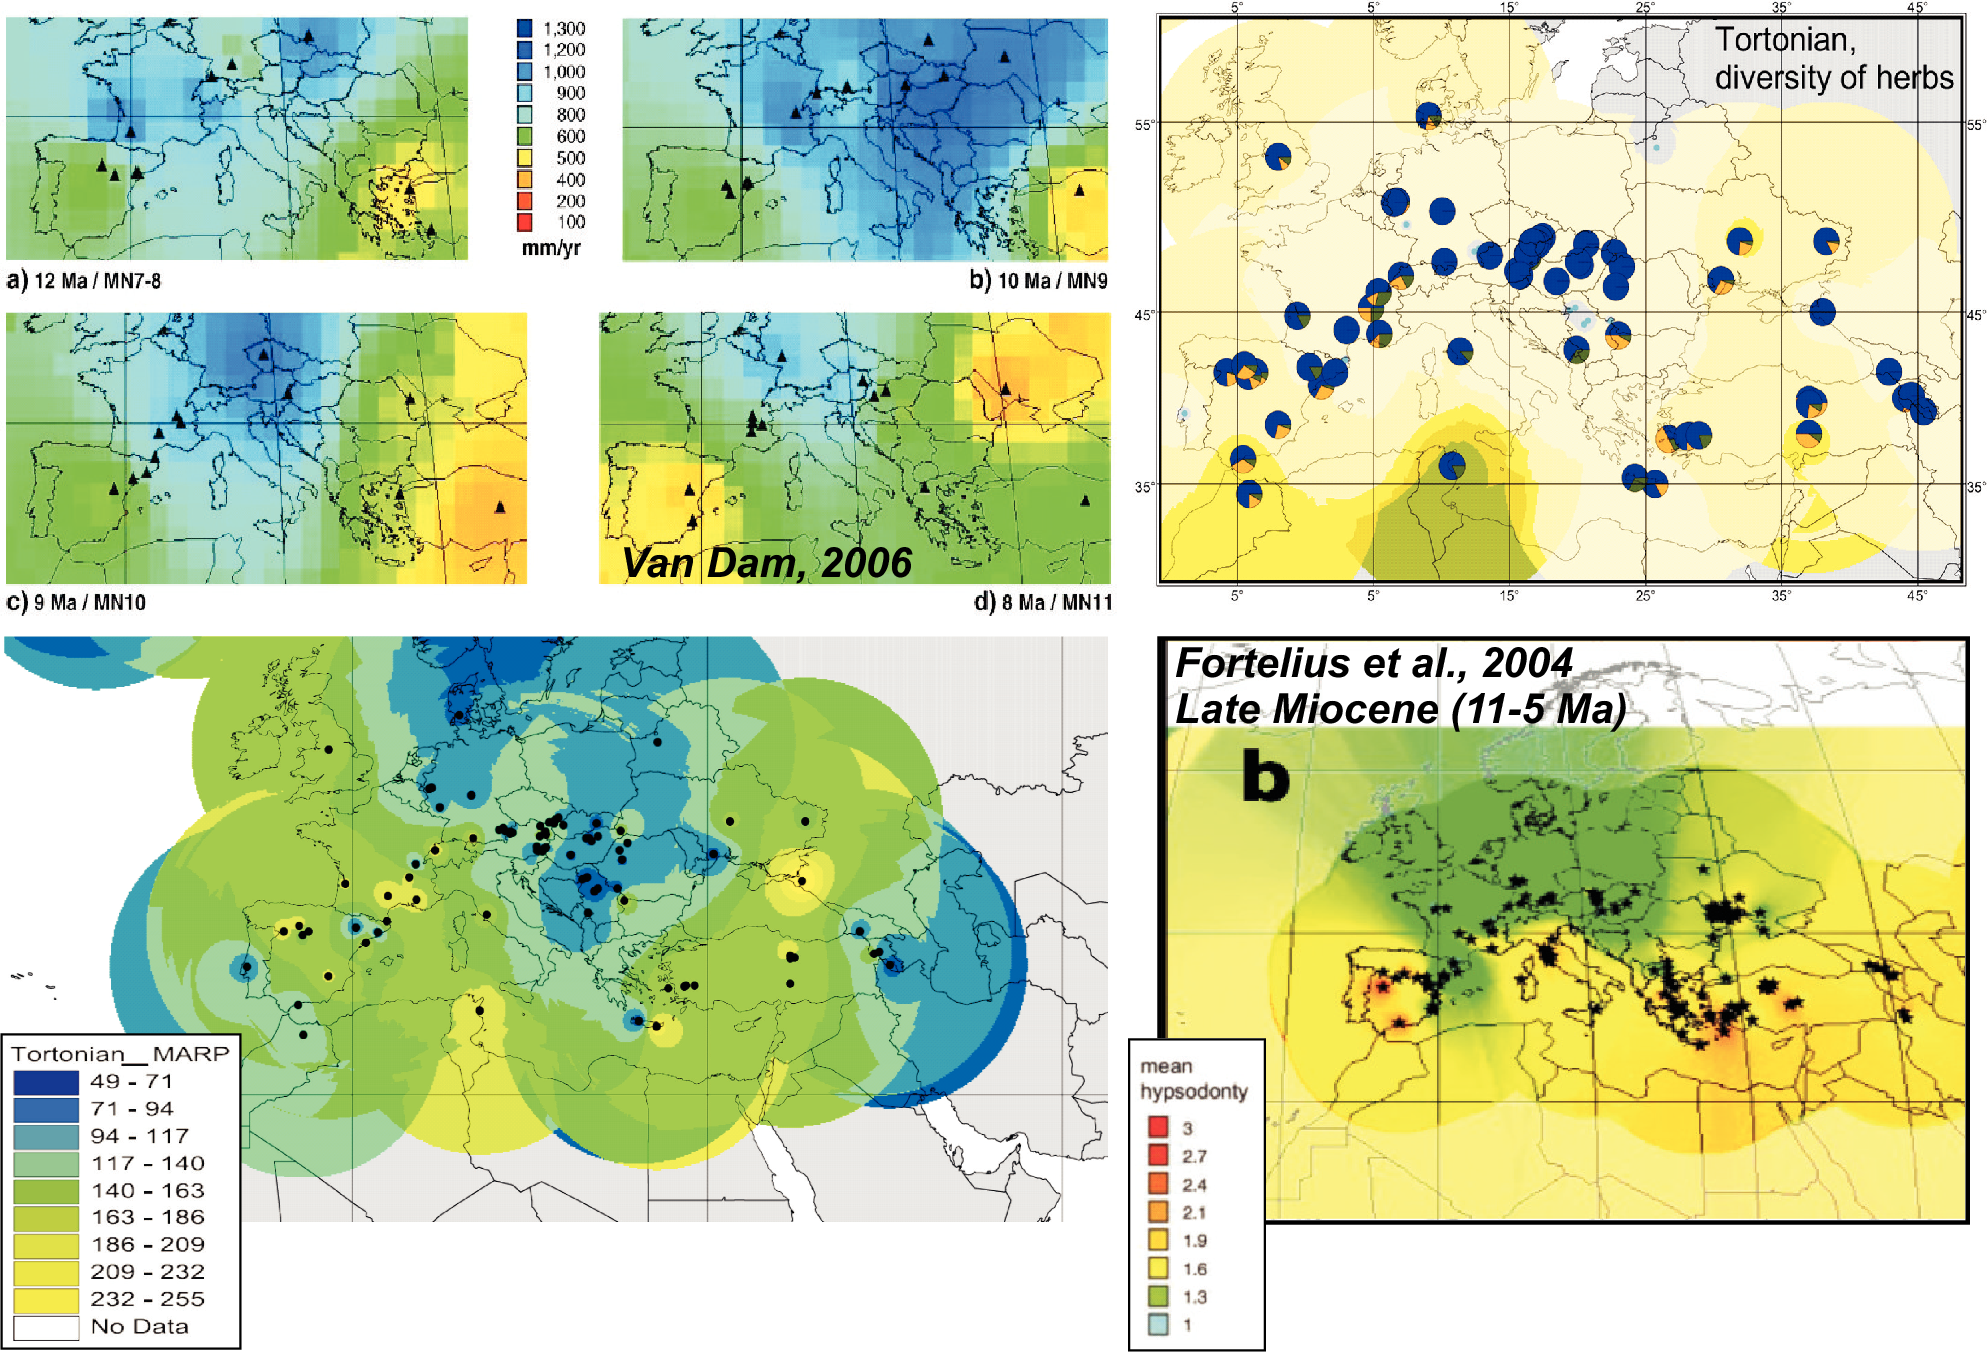
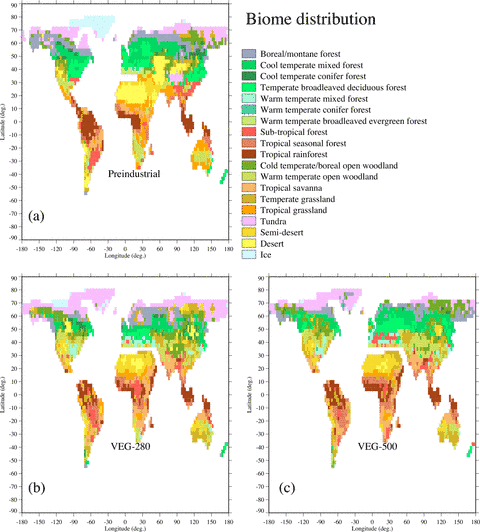
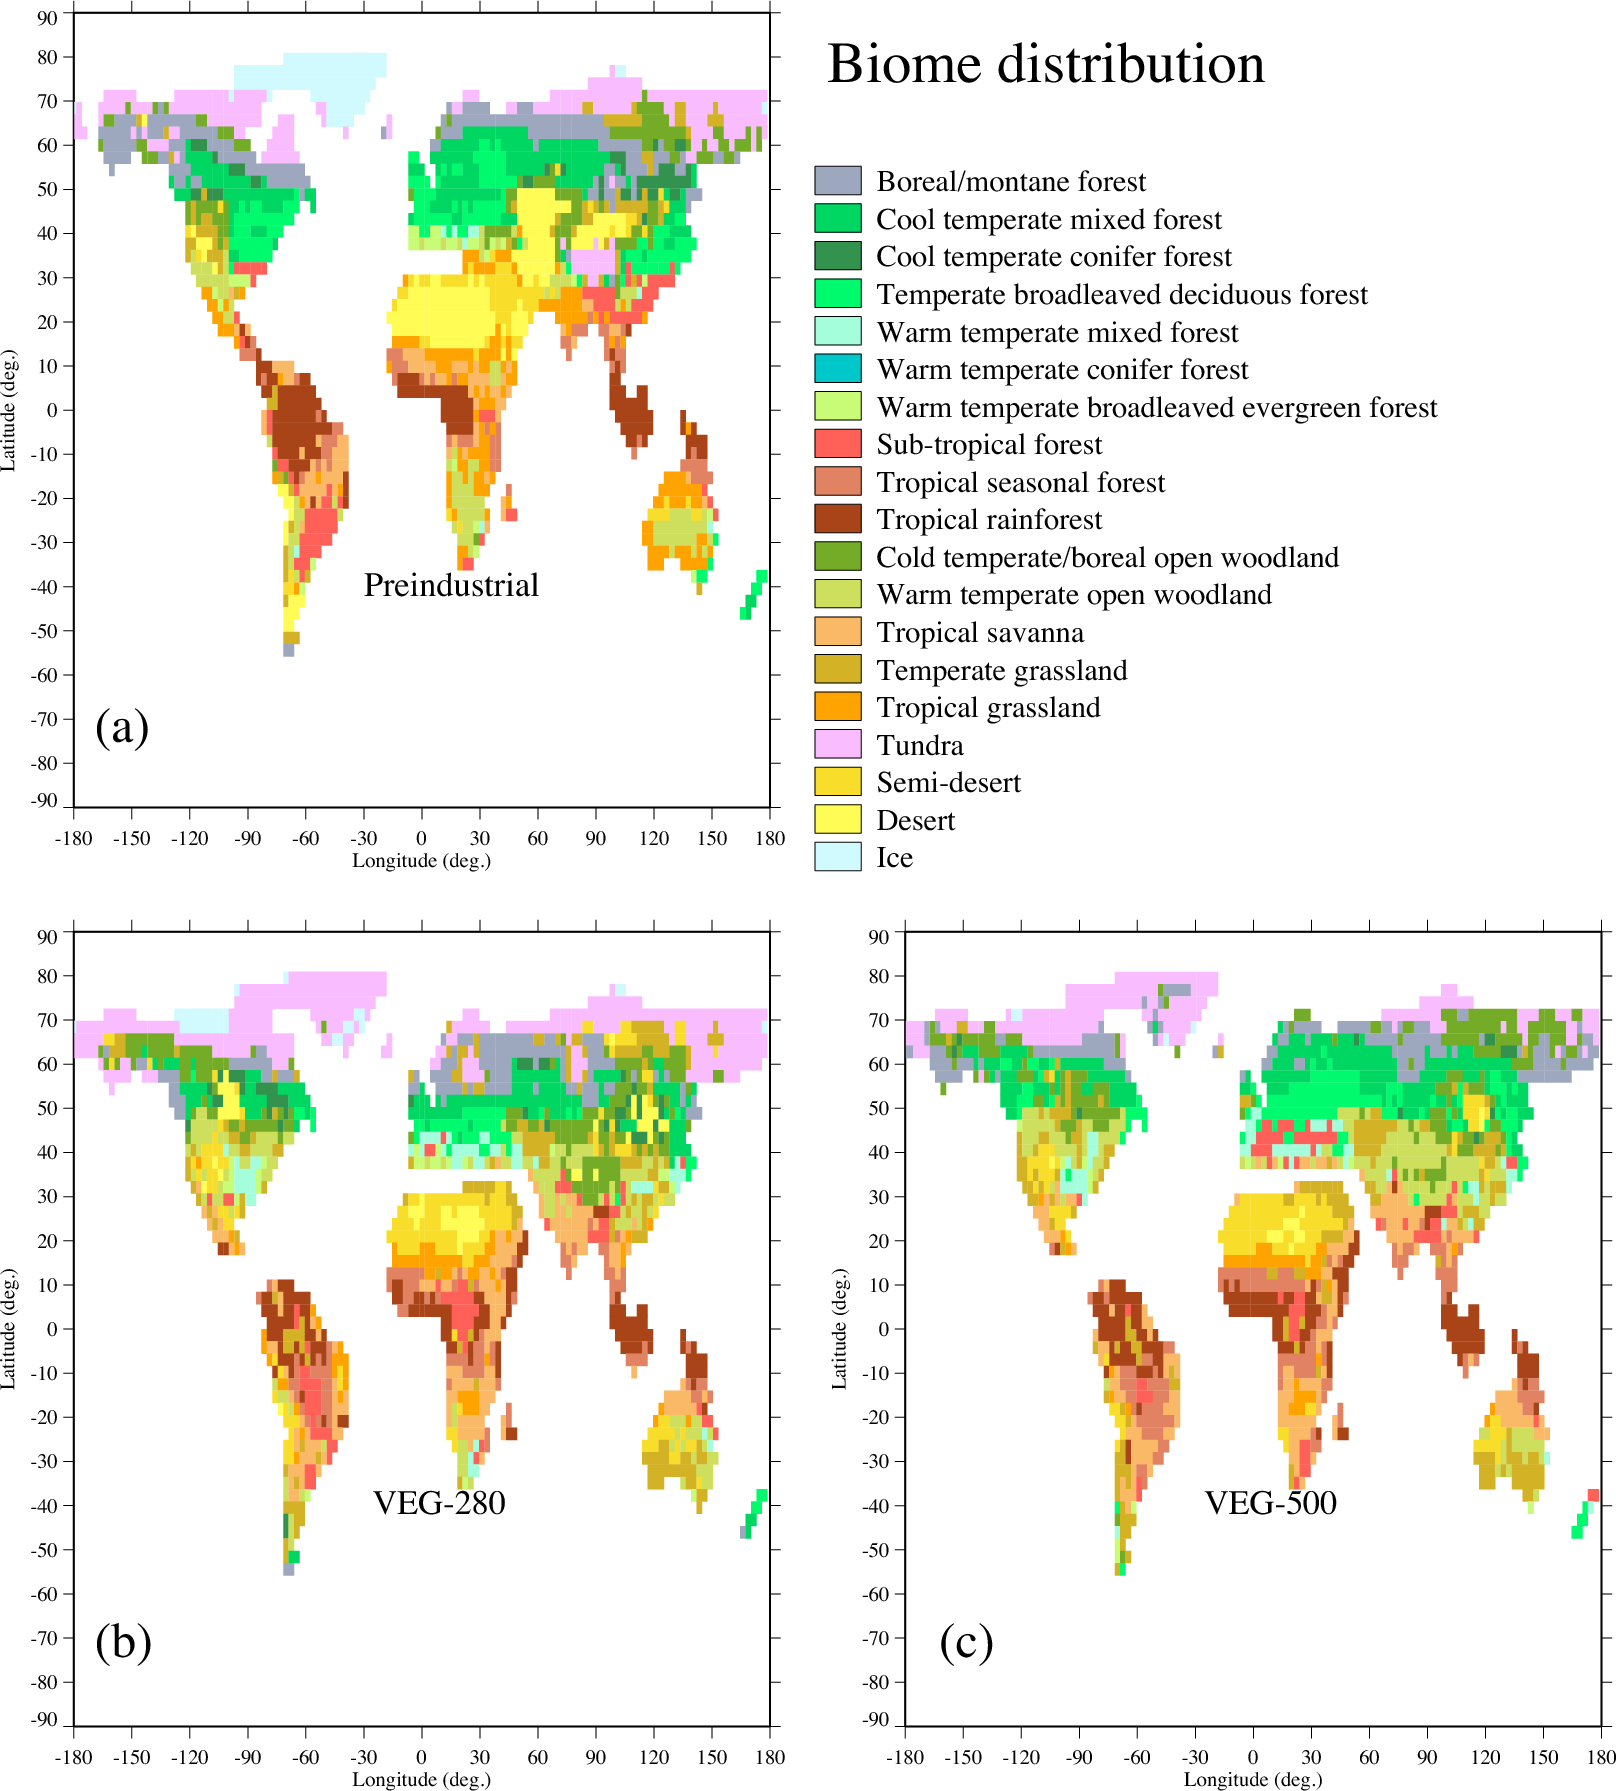
Figure 2: Potential vegetation distributions calculated with the CARAIB Dynamic Vegetation Model for the Middle Miocene, on the basis of the climatic fields reconstructed with the EMIC Planet Simulator. Only the climatic anomalies between the Middle Miocene and the pre-industrial are used in the vegetation reconstruction. (a) Vegetation for pre-industrial times, (b) Vegetation for the Middle Miocene with 280 ppmv of CO2, (c) Vegetation for the Middle Miocene with 500 ppmv of CO2.
References
Fortelius, M., Eronen, J.T. , Jernvall, J., Liu, L., Pushkina, D., Rinne, J., Tesakov, A., Vislobokova, I., Zhang, Z., Zhou, L., 2002. Fossil Mammals Resolve Regional Patterns of Eurasian Climate Change During 20 Million Years. Evolutionary Ecology Research, 4, 1005–1016.
François L., T. Utescher, E. Favre, A.-J. Henrot, P. Warnant, A. Micheels, B. Erdei, J.-P. Suc, R. Cheddadi, V. Mosbrugger, 2011. Modelling Late Miocene vegetation in Europe: results of the CARAIB model and comparison with palaeovegetation data. Paleogeography Paleoclimatology Paleoecology, in press.
Henrot A.-J., L. François, E. Favre, M. Butzin, M. Ouberdous, G. Munhoven, 2010. Effects of CO2, continental distribution, topography and vegetation changes on the climate at the Middle Miocene: a model study, Climate of the Past, 6, 675-694.
Mosbrugger V., T. Utescher, 1997. The coexistence approach - a method for quantitative reconstructions of Tertiary terrestrial palaeoclimate data using plant fossils. Palaeogeography, Palaeoclimatology, Palaeoecology, 134, 61-86.