Major results
- At first we tried to establish a very simplistic parameterization technique for present day wetlands modeling. The idea is to extend the scheme for data strived past climatic scenarios, once it is validated for present day. In achieving this, we used soil wetness parameter from dynamic vegetation model CARAIB (Otto et al.2002, Laurent et al.2008) along with terrain elevation gradient from GTOPO 30 to identify potential wetlands at present day. In this method, two sets of threshold values for soil wetness are chosen separately for northern latitudes (30°N-90°N) and for the rest of globe at flat areas (slope gradient < .3) to locate the wetlands. The result is validated with wetland areas from the GLWD database (Lehner et al.2004) over different regions.
| GLWD database (area in million km^2) | Modeled wetlands (area in million km^2) | |
| Total area of wetlands | 9.10 | 10.87 |
| Canada | 1.60 | 1.92 |
| Alaska | 0.45 | 0.11 |
| North America | 2.86 | 3.17 |
| South America | 1.59 | 1.55 |
| Europe | 0.26 | 1.52 |
| Africa | 1.31 | 1.33 |
| Asia | 2.90 | 2.97 |
- It is evident from the table that in our model global wetlands are over estimated by 1.7 mill. km^2. Although some of the wetlands are missing over Alaskan region, Europe is having more compared to GLWD. Otherwise, over the continents of Asia, Africa and south America, model estimation is close to the GLWD database.
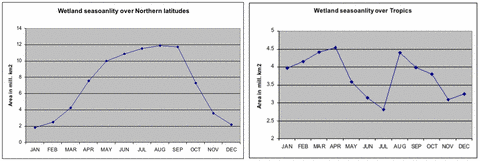
- Climatological soil wetness provided by CARAIB enables us to study the wetlands seasonality and its contribution to annual methane emission. In fact global wetlands show strong seasonality in their areal extent due to climatic forcing and these factors differ from northern latitude to tropics and sub-tropics. As a whole, wetlands vary from a maximum area of 15 mill. km^2 to to a minimum of 5 mill. km^2 annualy. The following figures describe seasonal pattern of wetland extent separately for northern latitudes (30°N-90°N) and tropics (40°S-20°N) over a climatological year.
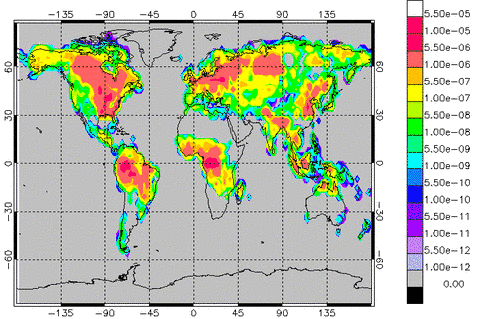
- The next aspect of our work is focused wetland emissions on a global scale. Methane emission from wetlands depends majorly on soil temperature and soil organic availability. In this present study we followed the emission parameterization method as adapted by Gedney et al. 2004 to prepare monthly global wetland methane emission maps. In fact, this topic has not received much attention in the literature up to now, but a few case studies and global inventories exist which try to establish a seasonal cycle of wetland occurrence and methane emissions (Aslemann and Crutzen 1989, Whalen and Reeburgh 1992, Milaon et al. 2005). According to these studies, the global wetland methane emissions are about a factor of 2 to 3 higher during June to September compared to the rest of the year. Apart from the seasonality of inundation, the other factors contributing to emission is the trend in soil temperature and the geographical distribution of soil organic matters. However it is to be noted that the seasonal cycle of methane emissions is not directly proportional to the seasonal wetland extent, because methane emissions depend non-linearly on soil temperature. Due to a strong temperature trend, methane emission from Northern wetlands is majorly affected by it. However, at tropical regions temperature does not vary much over the year and here the emission trend is mainly governed by wetland seasonality. From this model study it is found that wetland contributes to approximately 350 Tg methane per year to the atmosphere The figure below represents the climatological average map of global wetland methane emission rate.
- At present the wetland methane emission scheme as described, has been used interactively within the ECHAM chemistry climate model for present day methane simulation. Efforts are going on for Wetland modeling at LGM and subsequent climate simulation.
References
Aslemann, I., P.J Crutzen (1989), Global Distribution of Natural Freshwater Wetlands and Rice Paddies, their Net Primary productivity, Seasonality and Possible Methane Emissions, J. Atmos. Chemistry, 8, 307-358
Chappelaz, J.A., I.Y. Fung, and A.M. Thompson (1993b), The atmospheric CH4 increase since the last Glacial Maximum (1). Source estimates, Tellus, 45B(3), 228-241
Dällenbach, A. (2000), Changes in the atmospheric CH4 gradient between Greenland and Antarctica during the Last Glacial and the transition to the Holocene, Geophys. Res. Lett., 27(7), 1005-1008
Gedney N., P.M. Cox, C. Huntingford (2004), Climate feedback from wetland methane emissions, J. Geophys. Res., 31, L20503
Gedney, N., P.M.Cox (2003), The sensitivity of global climate model simulations to the representation of soil moisture heterogeneity, J. Hydrometeorol., 4, 1256-1275
Houghton J. T., et al.(2001), Projections of future climate change, Climate change 2001:The Scientific Basis, Contribution of Working Group I to the Third Assessment Report of The Intergovermental Panel on Climate Change,881 pp., Cambridge Univ. Press, New York
Kaplan J.O. (2002), Wetlands at the Last Glacial Maximum: Distribution and methane emissions, J. Geophys. Res., 29(6)
Kaplan J.O., Greg Folberth and Didier A. Hauglistine (2006), Role of methane and biogenic volatile organic compound sources in late glacial and Holocene fluctuations of atmospheric methane concentrations, Global Biogeochem. Cycles, 20, GB2016
Laurent JM, Francois LM, bar-Hen A, Bel L, Cheddadi R (2008). European bioclimatic acffinity grioups: Data-Model comparisons, Global and Planetary Change 61:28-40
Lehner, B. and P. Döll (2004): Development and validation of a global database of lakes, reservoir and wetlands, J. Hydrol., 296(1–4),1–22
Mialon A., A.Royer, M.Fily (2005): Wetland seasonal dynamics and interannual variability over northern high latitudes, derived from microwave satellite data, J. Geophys. Res., 110-D17102
Otto D., Rasse D., Kaplan J., Warrant P and Francois LM(2002), Biospheirc carbon stocks reconstructed at the Last Glacial Maximum: comparison between general circulation models using prescribed and computed sea surface temperature. Global Planetary Change 33:117-138
Shindell D.T., Bernadette P.Walter and Greg Faluvegi (2004), Impacts of climate change on methane emissions from wetlands, J. Geophys. Res., 31, L21202
Whalen, S. C., W. S. Reeburgh. (1992). Interannual variations in tundra methane flux: A 4-year time series at fixed sites. Global Biogeochem. Cycles 6:139-160
Worthy, D. E. J., I.Levin, F. Hooper, M. K. Ernst, and N.B.A. Trivett, Evidence for a link between climate and northern wetland methane emissions, J. Geophys. Res.,105(D3), 4031-4038, 2000


